CONCEPTS:
Macromolecules: A macromolecule is a very large molecule, such as protein, commonly created by polymerization of smaller subunits. They are typically composed of thousands of atoms or more.
Carbohydrates- The two types of carbohydrates are monosaccharides and polysaccharides, they provide energy for the cell. Monosaccharides are simple sugars and polysaccharides are storage of the sugar and have many roles in the cell.
Proteins-Any of a class of nitrogenous organic compounds that consist of large molecules composed of one or more long chains of amino acids
Lipids- Major roles of lipids are to store energy, create the cell membrane, and cell signaling
Nucleic Acids- DNA and RNA are the principal information molecules, DNA is double stranded and contains genetic information, and RNA is single stranded and is involved in protein synthesis, information transfer, transportations, and catalyzing reactions. DNA and RNA are made up of nucleotides.
PourposeThe purpose of this part of the lab was to identify the most efficient way to produce cheese.
HypothesisIf the four agents Chymosin (FPC), Rennin (NCB), Buttermilk, and Water were tested according to the procedure, then the FPC agent would be the most effective.
Procedure
HypothesisIf the four agents Chymosin (FPC), Rennin (NCB), Buttermilk, and Water were tested according to the procedure, then the FPC agent would be the most effective.
Procedure
- Label the four 6ml with the type of curdling agent and group number.
- Use a large pipet to transfer 3 ml of milk to each of the 6ml tubes.
- Use a small pipet and transfer the entire contents of the tubes of fermentation produced chymosin (FPC), natural bovine chymosin (NBC), or buttermilk to the labeled tube containing the milk. For water, fill the small transfer pipet to the bottom of the bulb and add to the labeled tube containing the milk. Use a different pipet for each transfer to avoid cross contamination.
- Cap the tubes and invert the tubes three times and then transfer to a 37 degree celsius water bath or place at body temperature (i.e. armpit) for incubation)
- Set a timer and check for curdling every 5 minutes, by gently inverting the tube and examining for curds.
- Record the time (in minutes) when the milk begins to curdle (small or large lumps) or solidify.
- If the milk has not curdled in 30 minutes, check for curdling every hour.
- In a data table, record the time (in minutes) when the milk begins to curdle (small or large lumps) or solidify.
- Upon return to the lab, during the next work period (next day in most lab classes), determine the amount of curds produced by each treatment
- For each treatment, weigh a paper cone and record the empty cone weight.
- Transfer the entire contents of a tube into a labeled filter paper cone over a suitable collection vessel. Once all liquid has drained through, dry the filter paper with the curds overnight.
- Weight the dry cone with curds, Subtract the dry cone weight. Record the weight of the curds.
- Repeat with each treatment.
- Create a data table that reports the Rate of Curd Production (weight/time) by each Curdling Agent.
- Create a bar graph the shows the Rate of Curd Production (weight/time) by each Curdling agent.
The FPC agent produced an almost solidified result in the time frame of 5 minutesThe NBC took a longer amount of time, and produced not as solidified results
The Buttermilk and Water took an extra day to curdle.
The amount of curds left over after drying appeared to be much less than what was left before.
The curds were firmly attached to the filter paper.
The Buttermilk and Water took an extra day to curdle.
The amount of curds left over after drying appeared to be much less than what was left before.
The curds were firmly attached to the filter paper.
Analysis
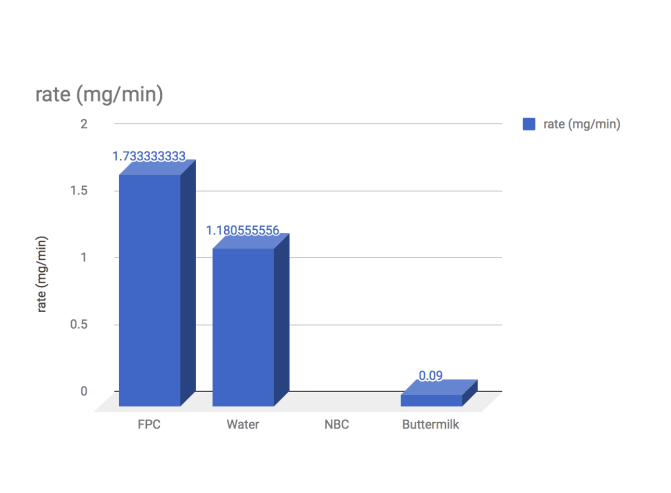
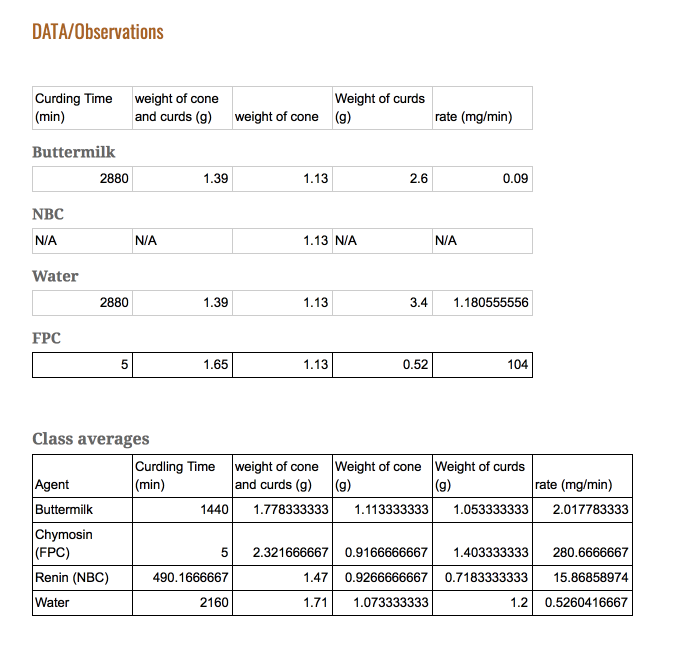
By looking at the data, we can see the effectiveness of the agents in terms of efficiency. The efficiency of an agent can be identified in two factors: Time taken to curdle, and the amount of curds made at the end. By dividing these two, it is possible to obtain a rate curdling. As seen in the last graph the agent with the highest rate was clearly the FPC. Therefore, it is possible to answer our purpose. The most efficient curdling agent is FPC.
With this result, it is possible to check our hypothesis. It was correct to say that FPC was the most efficient, proving our hypothesis.
The procedure of the lab provided the means to execute this lab, but also included some issues that may have affected results. First of all, each group member took charge of some individual cheese curdling agent. This meant that the cheeses could be followed throughout the lab. However, that also meant that each stage of the lab was performed by a different person, i.e. the warmth of the armpit, frequency of checking, even the clothes they were wearing. As there was a lack of communication, different methods were used to execute each step of the procedure (using different papers for weighing and filtering for example). This may have lead to an inconsistency in our data.
In order to fix these problems with the lab, there are several things that could be done. First of all, the procedure could be rewritten to include more specific instructions . This could mean that a specific filter paper would be identified. Another improvement would be to clarify whether the wet weight should be recorded. This was an item that not every group recorded, and therefore was something that could have been clarified and reviewed.
After doing this lab, we have investigated some of the agents that are used to produce cheese. This leads to a further investigation. The time taken to incubate the cheese was, in some cases, longer than what was anticipated. Therefore, it is conceivable that a higher temperature would lead to a higher production rate.
Conclusion
Claim:This data produces conclusive results. The FPC (Chymosin) agent was the most effective out of the four that were tested. There are two components to efficacy; time and amount produced.
Lead in:The procedure tested both. The agents tested in similar samples and incubated. The time was recorded when the milk curdled, and the sample weighed before and after the resultants were weighed. Through this process, the time taken to curdle the milk and the amount of cheese produced are measured.
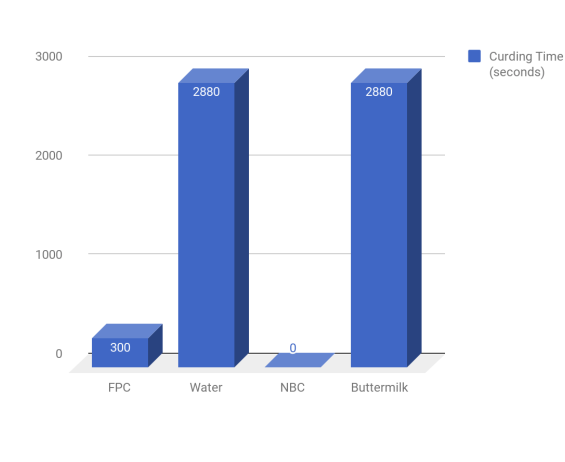
Evidence: In the former category, as you can see from the first graph, it is clear that the FPC agent produced results in 5 minutes, compared to other agents ranging from 26 minutes to 24 hours.
Analysis: This data provides evidence that the FPC is the fastest acting agent. The second component to efficacy is the amount of cheese produced.
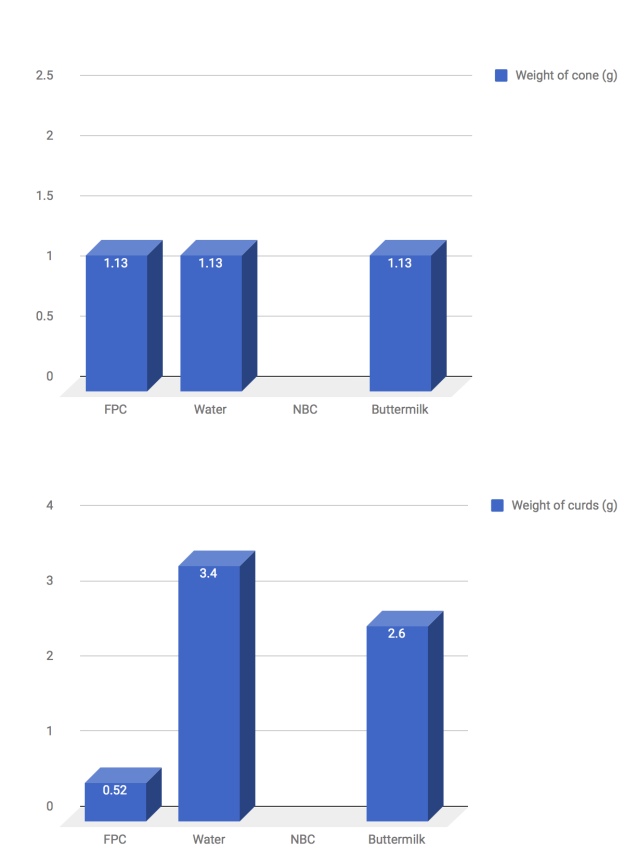
Evidence:It is shown that the FPC produced 2.5g of curds, compared to the closest competitor at 2.14g ( Note that the data is not on the graph, this is due to lab error, this snippet of data is taken from other groups).
Analysis: This also defines FPC as the agent that produces the most curds in the circumstances. Combining these two factors yields us with the result that FPC is the most efficient agent tested. This is backed up with the results, both of which put FPC as the most efficient.
Part 2
PourposeThe purpose of this part of the lab was to see if the amount of FPC added changes curdling time.
Hypothesis If 2x the amount of FPC is added to milk, then curdling time will be reduced by at least one minute. I also hypothesize that the increased amount of FPC will produce more curds and vice versa for the decreased 0.5x amount. Our control is 100 microliters of FPC
Procedure
- Label the 3 6ml with the amount of FPC added ( 2x, 1x for a control, or 0.5x) and group number.
- Use a large pipet to transfer 3 ml of milk to each of the 6ml tubes.
- Add the amounts of FPC to their respective tubes and incubate.
- Set a timer and check for curdling every 1 minute.
- Record the time (in minutes) when the milk begins to curdle (small or large lumps) or solidify.
- If the milk has not curdled in 5 minutes, check every 30 seconds.
- In a data table, record the time (in minutes) when the milk begins to curdle (small or large lumps) or solidify.
- Transfer the entire contents of a tube into a labeled filter paper cone over a suitable collection vessel. Once all liquid has drained through, dry the filter paper with the curds overnight.
- Weight the dry cone with curds, Subtract the dry cone weight. Record the weight of the curds.
- Repeat with each treatment.
- Create a data table that reports the Rate of Curd Production (weight/time) by each Curdling Agent.
- Create a bar graph the shows the Rate of Curd Production (weight/time) by each Curdling agent.
As suspected, the time for curdling was nearly cut in half for the increased dosage, and the rest of the data has shown that the increased amount produces more.
Also predicted, the decreased amount took a bit longer than the others, and the rest of the data has shown that the decreased amount produces less.
Also predicted, the decreased amount took a bit longer than the others, and the rest of the data has shown that the decreased amount produces less.
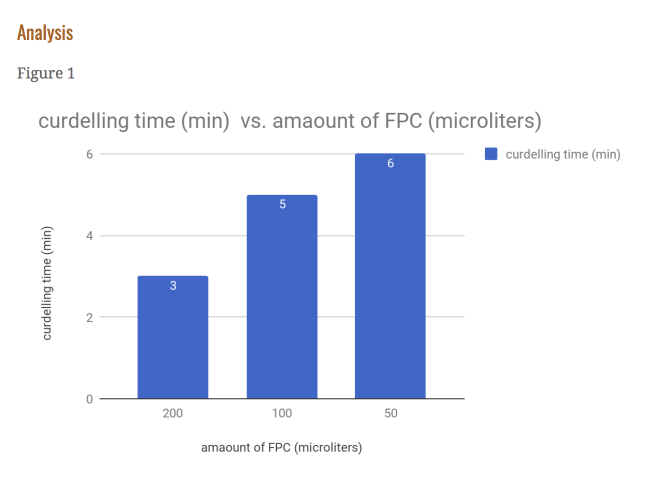
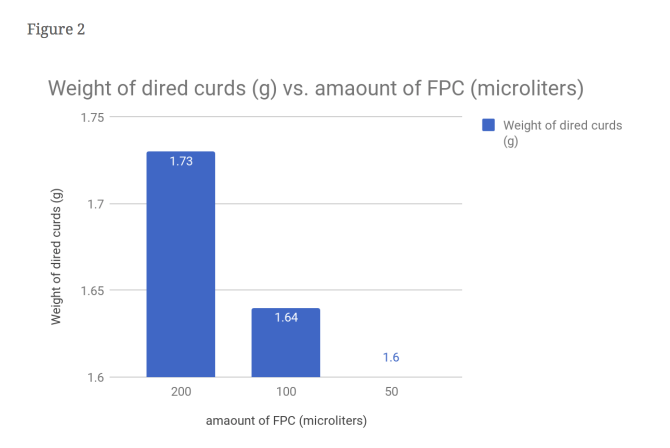
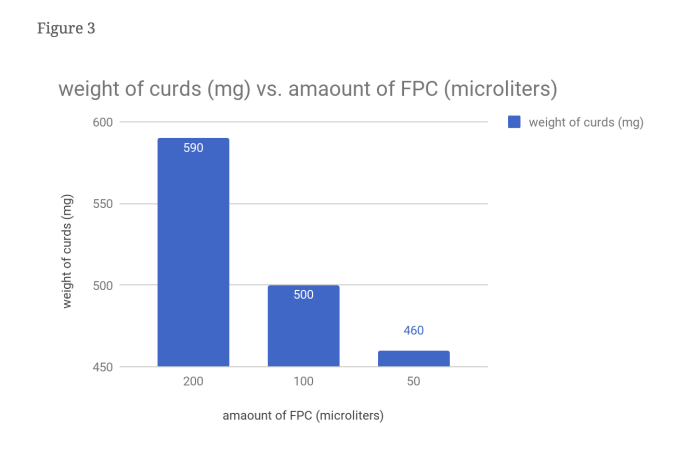
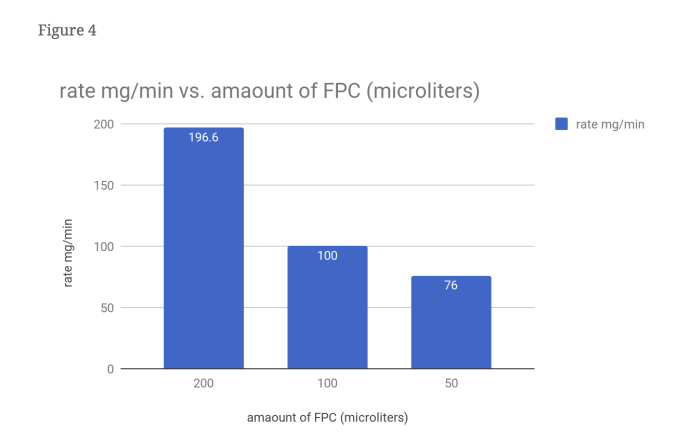
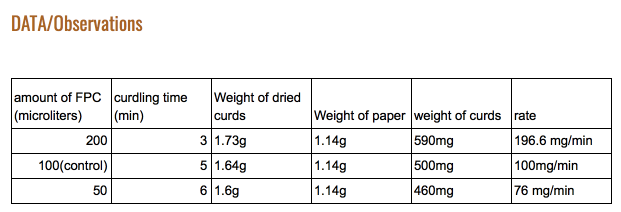
From this data, one can see that our hypothesis was correct. As seen in figure 1, the time it took for the 2x FPC to curdle the milk was cut nearly in half, with 3 minutes as its time. It can also bee seen figure 4 that the amount of curds produced by the 2x FPC is staggering compared to the others, producing 196.6 mg of curds per minute. It understandable that in figure 3 the 2x is weighs more (590 mg) than the rest due to increased volume. The same can’t be said for the 0.5x FPC though. In figure 1, you can see that it took a minute longer than the control to curdle (6 minutes). You can also observe in figure 4, that the reduced amount of FPC produced the least amounts of curds, with 76 mg of curds per minute. Unsurprisingly the weight is substantially less than the other two, with a weight of 460 mg. We had a control for this purpose; To serve as a baseline to see the results better.
We could improve this lab by syncing the time we incubate, to get more accurate results, which we did not do. We also should have gone to the next step individually as our milk curdled.
Conclusion
Claim: We strove to see if a high amount of FPC produced more and curdle in less time, while a low amount produced less and curled for a longer time.
Lead in: We did this by using three different amounts of FPC, 2x the amount the control FPC(200 microliters), the control (100 microliters), and half the amount of the control (50 microliters). We incubated them in our armpits and checked every minute to see if curdling took place and waited for everyone’s milk to curdle.
Evidence: Our hypothesis was correct because in figure 1, you can see the time it took for the 2x FPC to curdle the milk was cut nearly in half compared to the control, with 3 minutes as its time.
Analysis: As seen in the graph, you can see that by increasing the amount of FPC, you reduce the amount of curdling time substantially, this is probably because when a base is introduced to a lot of acid, the reaction take less time.
Evidence: It can also bee seen figure 4 that the amount of curds produced by the 2x FPC is staggering compared to the others, producing 196.6 mg of curds per minute.
Analysis: You can see from the evidence that the more FPC you put in, the more curds you produce. This is probably because there is more volume and the increased amount of FPC causes the base:acid ratio to change and produces more.
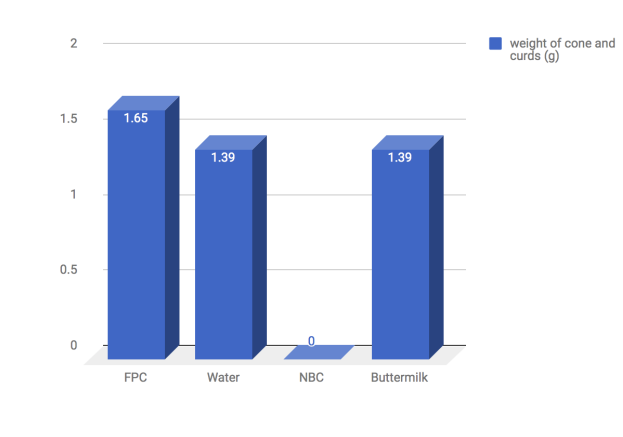
Evidence: It understandable that in figure 3 the 2x is weighs more (590 mg) than the rest due to increased volume.
Analysis: Is is probably because there is more liquid in the vile.
The same can’t be said for the 0.5x FPC though.In figure 1, you can see that it took a minute longer than the control to curdle (6 minutes)You can also observe in figure 4, that the reduced amount of FPC produced the least amounts of curds, with 76 mg of curds per minute.
Part 3
PURPOSEThe purpose of this part of the lab was to identify the different macromolecules that were in our cheese.
HYPOTHESISIf our cheese sample was tested for four macromolecules (glucose, starch, protein, and lipid), and glucose, protein, and lipid molecules would be found in the sample.
PROCEDURE
We could improve this lab by syncing the time we incubate, to get more accurate results, which we did not do. We also should have gone to the next step individually as our milk curdled.
Conclusion
Claim: We strove to see if a high amount of FPC produced more and curdle in less time, while a low amount produced less and curled for a longer time.
Lead in: We did this by using three different amounts of FPC, 2x the amount the control FPC(200 microliters), the control (100 microliters), and half the amount of the control (50 microliters). We incubated them in our armpits and checked every minute to see if curdling took place and waited for everyone’s milk to curdle.
Evidence: Our hypothesis was correct because in figure 1, you can see the time it took for the 2x FPC to curdle the milk was cut nearly in half compared to the control, with 3 minutes as its time.
Analysis: As seen in the graph, you can see that by increasing the amount of FPC, you reduce the amount of curdling time substantially, this is probably because when a base is introduced to a lot of acid, the reaction take less time.
Evidence: It can also bee seen figure 4 that the amount of curds produced by the 2x FPC is staggering compared to the others, producing 196.6 mg of curds per minute.
Analysis: You can see from the evidence that the more FPC you put in, the more curds you produce. This is probably because there is more volume and the increased amount of FPC causes the base:acid ratio to change and produces more.
Evidence: It understandable that in figure 3 the 2x is weighs more (590 mg) than the rest due to increased volume.
Analysis: Is is probably because there is more liquid in the vile.
The same can’t be said for the 0.5x FPC though.In figure 1, you can see that it took a minute longer than the control to curdle (6 minutes)You can also observe in figure 4, that the reduced amount of FPC produced the least amounts of curds, with 76 mg of curds per minute.
Part 3
PURPOSEThe purpose of this part of the lab was to identify the different macromolecules that were in our cheese.
HYPOTHESISIf our cheese sample was tested for four macromolecules (glucose, starch, protein, and lipid), and glucose, protein, and lipid molecules would be found in the sample.
PROCEDURE
- Monosaccharide/Glucose
- Obtain a vial, and place into it a cheese sample that is of the approximate volume of 5 mL.
- Into this vial, pipet 5 mL of Benedict's solution. Mix well.
- Heat for 2 minutes in a boiling hot water bath (100 mL of water in a 250-mL beaker at 100 degrees celsius)
- Record all color changes
- Polysaccharide/Starch
- In a test tube, mix 5 mL of cheese sample with 0.625 mL of Lugol’s iodine.
- Gently swirl to mix. Do not heat.
- Record all color changes.
- Protein
- Place 4 mL of a cheese sample in a test tube.
- Add 1.5 mL of Biuret reagent to the test tube.
- Mix well.
- Record the color change after 30 seconds.
- Lipid
- Paper Test
- Melt the cheese in a test tube by inserting the vial in a heated water bath.
- Pour the melted cheese onto a piece of paper.
- After waiting for the cheese to dry and disperse, hold the paper to light.
- Record the percentage of translucence.
- Sudan IV Test
- Add 120 microliters of Sudan IV solution to a 4 mL cheese sample.
- Gently mix.
- Paper Test
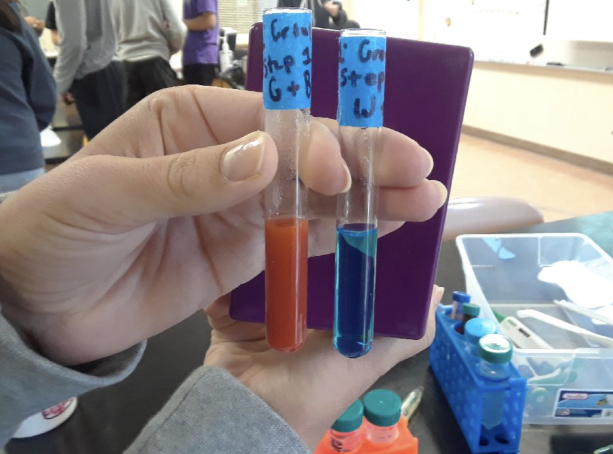
- Monosaccharide
- The color changed from blue to a green color.
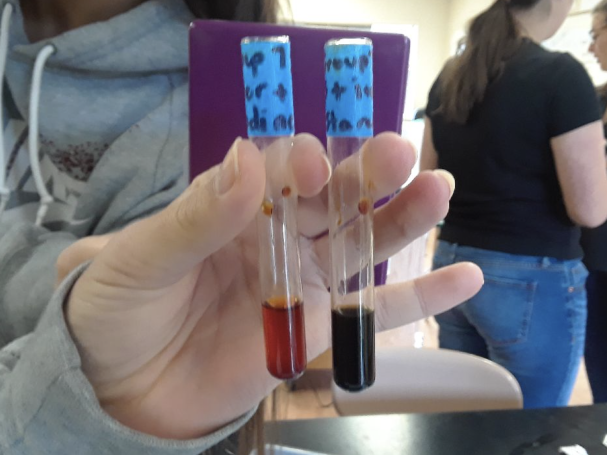
- Polysaccharide
- The color of the cheese did not react in a standard pattern for all groups in the class.
- A portion of the class found that the color went to a very dark brown/black color.
- The remainder of the class found a more reddish color.
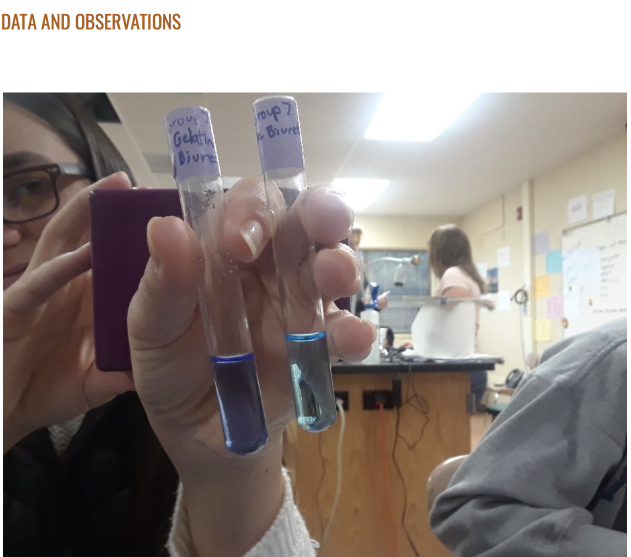
- Protein
- The color of the vial changed from a violet color to a purple color.
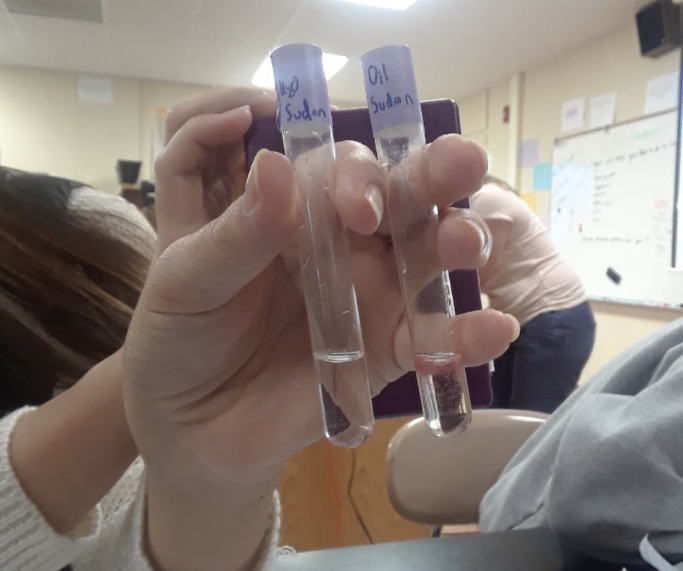
- Fat
- The color of the cheese using the Sudan IV test was orange
- The color of the melted cheese was more translucent.
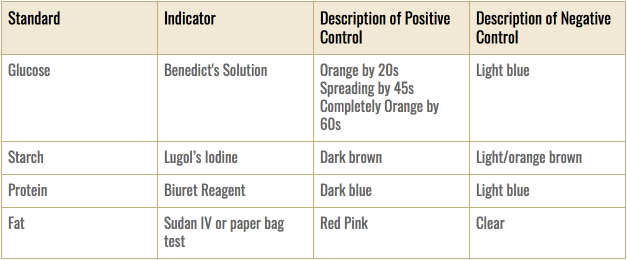
What these results mean is not conclusive in its entirety. Using data from the control tests, it was possible to attempt to interpret each of the tests in terms of their results. As seen in figure 1, four macromolecules were tested. For the first item, the color of the vial turned a cloudy green. This was evidence of a reaction, and therefore indicated the presence of monosaccharides in the cheese sample.
For the second item, glucose, the data was not quite as clear. The groups in the class doing the lab did not produce results that matched each other. Therefore, no conclusion can be drawn from those results.
The third item, protein, was conclusive. The fact that the vial turned a different color was indicative to the presence of that macromolecule. This result was similar across all tests done both in our lab group and class.
The fourth item in which we tested the cheese was for the presence of lipids (fats). This was done using two methods. The first was done using the Sudan IV test. This was another standard color change test. In this, our class found that there was fat in our sample. This was also corroborated by our second test, in which the translucency of melted cheese on a piece of paper was tested. In this, we found that the paper was more translucent, indicating that there was fat in the cheese.
In terms of the hypothesis, it was proved to be accurate in predicting the presence of all three items (glucose, protein, and fat), and the data was unclear for the remaining macromolecule (starch), which was predicted to be absent in the sample.
This lab, in terms of procedure, appears to be fairly straightforward. However, problems arose in the interpretations of results. Even after during the control tests, it was not extremely evident whether a certain macromolecule was present in the sample. This was exemplified in the starch test (figure 1), in which there were different results in the class. Other calls on the remaining molecules were not made with absolute certainty.
A specific path to improve the lab is not evident. A possibility is to do the positive and negative controls along with the sample, in order to provide a specific comparison in which to judge the categorization of the sample. This, however, could lead to other problems with materials and procedure that would have to be remedied.
These tests were limited, as they only tested for the presence of the macromolecule, and not the amount. Further tests might be to identify the percentages of the components of the sample cheese, and the other molecules that are a portion of the makeup of the cheese. Such tests are, in all probability, beyond the reach of our class, and would not lead to much benefit.
CONCLUSION
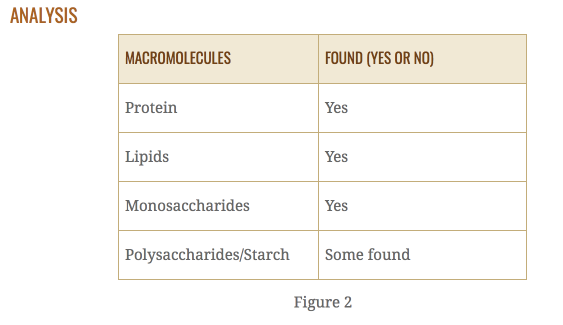
Claim:From these data and analysis, we come to the conclusion that our sample cheese contained glucose, protein, and fat.
Lead in:Results were gained through a procedure that started with finding positive and negative control results for four macromolecules: glucose, starch, protein, and fat. By testing the cheese sample, it was compared to the controls to identify the components of our cheese.
Evidence:The first result was that of glucose. The color changed when tested, aligning with our positive control.
Analysis: This positively identifies it as a component in the cheese (Figure 2).
Evidence: For the second set of results, the positive control was very similar to the sample when tested for protein.
Analysis: This means that protein was present in our sample (Figure 2).
Evidence:For the last macromolecule, both the paper test and the Sudan IV test found that the results corroborated with the positive control.
Analysis:This indicates that lipids (fats) were present in our cheese sample.
For the second item, glucose, the data was not quite as clear. The groups in the class doing the lab did not produce results that matched each other. Therefore, no conclusion can be drawn from those results.
The third item, protein, was conclusive. The fact that the vial turned a different color was indicative to the presence of that macromolecule. This result was similar across all tests done both in our lab group and class.
The fourth item in which we tested the cheese was for the presence of lipids (fats). This was done using two methods. The first was done using the Sudan IV test. This was another standard color change test. In this, our class found that there was fat in our sample. This was also corroborated by our second test, in which the translucency of melted cheese on a piece of paper was tested. In this, we found that the paper was more translucent, indicating that there was fat in the cheese.
In terms of the hypothesis, it was proved to be accurate in predicting the presence of all three items (glucose, protein, and fat), and the data was unclear for the remaining macromolecule (starch), which was predicted to be absent in the sample.
This lab, in terms of procedure, appears to be fairly straightforward. However, problems arose in the interpretations of results. Even after during the control tests, it was not extremely evident whether a certain macromolecule was present in the sample. This was exemplified in the starch test (figure 1), in which there were different results in the class. Other calls on the remaining molecules were not made with absolute certainty.
A specific path to improve the lab is not evident. A possibility is to do the positive and negative controls along with the sample, in order to provide a specific comparison in which to judge the categorization of the sample. This, however, could lead to other problems with materials and procedure that would have to be remedied.
These tests were limited, as they only tested for the presence of the macromolecule, and not the amount. Further tests might be to identify the percentages of the components of the sample cheese, and the other molecules that are a portion of the makeup of the cheese. Such tests are, in all probability, beyond the reach of our class, and would not lead to much benefit.
CONCLUSION
Claim:From these data and analysis, we come to the conclusion that our sample cheese contained glucose, protein, and fat.
Lead in:Results were gained through a procedure that started with finding positive and negative control results for four macromolecules: glucose, starch, protein, and fat. By testing the cheese sample, it was compared to the controls to identify the components of our cheese.
Evidence:The first result was that of glucose. The color changed when tested, aligning with our positive control.
Analysis: This positively identifies it as a component in the cheese (Figure 2).
Evidence: For the second set of results, the positive control was very similar to the sample when tested for protein.
Analysis: This means that protein was present in our sample (Figure 2).
Evidence:For the last macromolecule, both the paper test and the Sudan IV test found that the results corroborated with the positive control.
Analysis:This indicates that lipids (fats) were present in our cheese sample.
Reflection
My group had a few communication issues, one was no where to be found when we started the lab, and the rest of us were scrambling around doing our own thing for a while until we grouped together and began to combine our efforts to get results. We took a little longer than the other groups because we had messed up the h20 curdling process in phase 1, and we had some difficulties with the macromolecules lab . As a result, we had to work quickly. We stayed on task and shared portions of the work, helping each other as necessary. Overall I'd say that at first we had difficulties working together, but in the end we began to work together and Finnish the lab efficiently.
